No matter the type or size of an institution, too many campuses don’t have a good grasp of their space—how much they have, what type of space, and who owns it. “That should serve as your starting point,” says Lisa Keith, a principal at Ayers Saint Gross, an architectural firm specializing in master plans and building designs for higher education institutions.
Keep in mind that not all space is equal, says Keith, who heads up the design firm’s space analytics and modeling group. Some institutions have ample space that is poorly used, while others are constrained by legacy buildings and configurations that don’t meet current needs. “The automatic response for many is to think that they need more space, when what they more likely need is a better use of space.” (Read also, “Reshape Your Space” beginning on page 18.)
Start With Good Data
Determining the difference between the space that you have and the space you need starts with good data, but even that can be challenging, admits Keith. For instance, particularly within the public institution environment, some states have severely outdated guidelines and building efficiency ratios that are no longer applicable. “They might want to see academic buildings that are 75 percent efficient. But, how do you calculate that when current teaching modalities call for more open spaces for informal collaboration, and active and flexible learning environments?” asks Keith. Included in those outdated metrics is space per classroom seat. “When I entered the industry in 1990, it was about 15 square feet per student. Now the average is 25 square feet, depending on the size of the institution.”
The first step for successful space-related decision making is a comprehensive inventory with an updated classification system, agreed-upon common nomenclature, and a consistent framework for how to assess and compare space.
Lost in the Space Debate
Too often, an honest assessment of administration and academic offices is neglected in campus space discussions. “If a campus is not re-evaluating office sizes, leaders should step back and consider that between 25 percent and 35 percent of the facilities footprint on a typical campus is office space—more than the typical 10 percent for classrooms,” says Keith.
Because some faculty may have multiple office locations, it becomes difficult to agree upon, and apply, a standard for office use. “For a truly honest assessment, you must take stock of everything. Office support areas, work rooms, supply closets, and conference rooms account for a lot of square footage on any campus.”
While the debate isn’t settled about the benefits or drawbacks of an open office environment, it is clear that the days of building 150-square-foot offices are over; the trend today is closer to 100 to 120 square feet. “There are ways to still provide privacy and quiet spaces even as you incorporate more unassigned spaces and collaboration areas to huddle on a project,” says Keith.
Leaders must also be aware of jobs that require quiet concentration. There are also fairness and equity questions to consider when deciding who gets an office—or more than one office. Science and engineering faculty may need workspaces near research labs in addition to private space within their departments.
Removing the politics from office space requires having clear policies and enforcing them, says Keith. “The lack of policies, policies that are out of date, or the lack of policy enforcement contribute to underused and ill-used spaces. Having useful analytics is a good first step, but the data itself can’t set priorities or interpret outcomes. Leaders must be willing to have those difficult conversations around space management, space ownership, and space policy.”
Who Owns This Space?
Keith suggests starting witha basic question: Who ownsthis space? One drawback in a budgeting approach such as the responsibility centered management (RCM) model is when the campus starts charging departments for space.
Rather than creating an environment where everyone is willing to share space, the tendency is for people to put a stake in ground. “My department is paying for this space, so you don’t get to use it.”
In that context, the ability to talk about shared space and efficiency goes out the window, and as a result, few units make best use of their space. “If you want to create a culture of shared space on a campus, you have to create that mindset,” Keith says.
She suggests creating a classroom, office, or space committee where everyone takes off their departmental hats to look at space holistically.
Keith offers these tips:
Don’t shortchange a process for expediency, since that may shortchange the outcome as well. “One temptation is to try to shove so much into a new build or renovation that you end up with spaces that are adequate for some things, but not great for anything. Give the project time to go through adequate planning, so that you understand the likely nuances of how that space might be used,” she says.
Know your needs before partnering with the private industry, so that the planned space meets your need. For instance, developers may want to build apartment-style units because those are most lucrative for them. “That may be fine for upperclassmen, but it may not be the best match for freshmen in need of ample shared space to connect and engage,” says Keith.
Finally, beware of gifts that lock you in. “Good space decision making may mean walking away from donor funding for something that you don’t actually need or that will burden the institution over time with inefficient, inflexible space.”
KARLA HIGNITE, Fort Walton Beach, Fla., is a contributing editor for Business Officer.
Keeping campuses and aging facilities in pristine condition can strain a college or university’s budget. As financial pressures intensify, it’s not surprising that more institutions are beginning to explore outsourced facilities management (FM). The obstacle: The term “outsourcing” often raises concerns about job loss and service quality.
How can you avoid the negatives? By approaching the FM service provider as a partner and shaping your relationship around the values of trust, shared goals, and advancing your mission.
Such a partnership has been the foundation of the 15-year relationship between JLL and Spalding University, Louisville, Ky. Our experience provides some critical lessons for alleviating employee concerns and establishing a successful outsourcing relationship.
It’s Not About Job Loss
Assumptions about job loss are often top of mind in conversations about outsourcing. Yet, your future FM service provider will be keenly aware that your facilities management team has institutional knowledge that it can’t easily replicate. Retaining employees will be a priority. Conversely, transitioning to the service provider will give your former employees access to a wealth of resources, tools, and best practices, along with personal development and career options.
To help ease transition fears, ask your prospective provider to share data about turnover rates and average employee tenure. Also, be sure to give employees the opportunity to ask the provider questions and address their concerns head-on.
Contract Negotiations
Concerns also tend to revolve around loss of valued benefits and compensation. Yet, the reality shows that these concerns are misplaced.
In JLL’s practice, transitioning employees gain benefits and compensation on par with, or better than, what they had before. If your employees are unionized or receive full or partial tuition reimbursement, you can work with your service provider to maintain parity. Before you sign on the dotted line, make sure that you clarify your deal-breaker issues. If a provider isn’t willing to negotiate, it’s a good signal to look elsewhere.
While Spalding did not have a large FM team when JLL was brought on board, many organizations do. Whatever the size of your team, your potential FM provider should be willing to provide details about roles, responsibilities, benefits, and compensation.
Transparency Is Key
The unknown creates anxiety and ignites rumors. Before you advance your decision to outsource, meet with your key stakeholders to discuss goals, plans, and outcomes. It’s not unusual for an FM service provider to meet with a range of stakeholders—including trustees, administrators, professors, and employees—before an outsourcing agreement is ever signed. When everyone is included in the process, you can dispel negative assumptions and create a positive environment from the outset.
The Care Factor
Aside from their fundamental job concerns, employees also may worry about leaving a cozy university community to join a large, faceless real estate services company. It’s a critical concern, because job satisfaction and advancement opportunities heavily influence whether transitioned employees will continue to support your campus.
Ask your potential FM partner about its onboarding process for new employees. Will transitioning employees receive training in best practices and leading FM technologies? Will a dedicated HR contact support them throughout their career?
Creative Cost Savings
When JLL first started working with Spalding University, the priority was to find creative ways to reduce costs and maximize resources for its 600,000+ square feet of facilities—while maintaining high-quality, proactive services. Also important was a long-term capital improvement plan backed by preventive maintenance.
Within the first 60 days, JLL reduced operating expenses by $100,000 annually by restructuring janitorial, elevator maintenance, and landscaping service contracts. For creative cost savings, JLL procured office furnishings at public auctions. Instead of hiring project managers, the FM team managed facility renovations itself, and building engineers pitched in to set up and break down campus events. Optimizing resources enabled Spalding to divert budget toward other campus and community improvements.
A True Partnership
Spalding has expanded its real estate footprint by 207,386 square feet since 2003, yet facility management costshave declined from about $5 to $3.60 per square foot. That’s roughly $2 per square foot less than the average cost for higher education FM.
From the start, JLL has been embedded in the Spalding campus community. Throughout our relationship, we’ve collaborated to expand Spalding’s community service mission and establish its leadership role in the planning and renewal of nearby neighborhoods.
Outsourcing services shouldn’t be about making trade-offs, but about creating a collaborative and creative partnership. It’s possible to create a relationship that honors employees, takes service to the next level, and also helps to advance your mission.
SUBMITTED BY Ron Gregory, executive vice president, integrated facilities management, higher education, JLL; and Tori Murden McClure, president, Spalding University, Louisville, Ky.
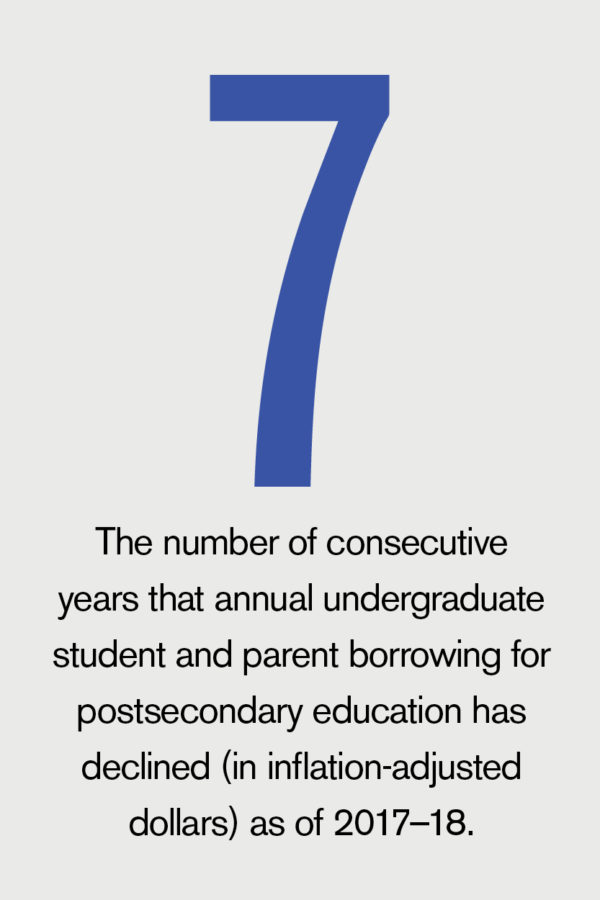
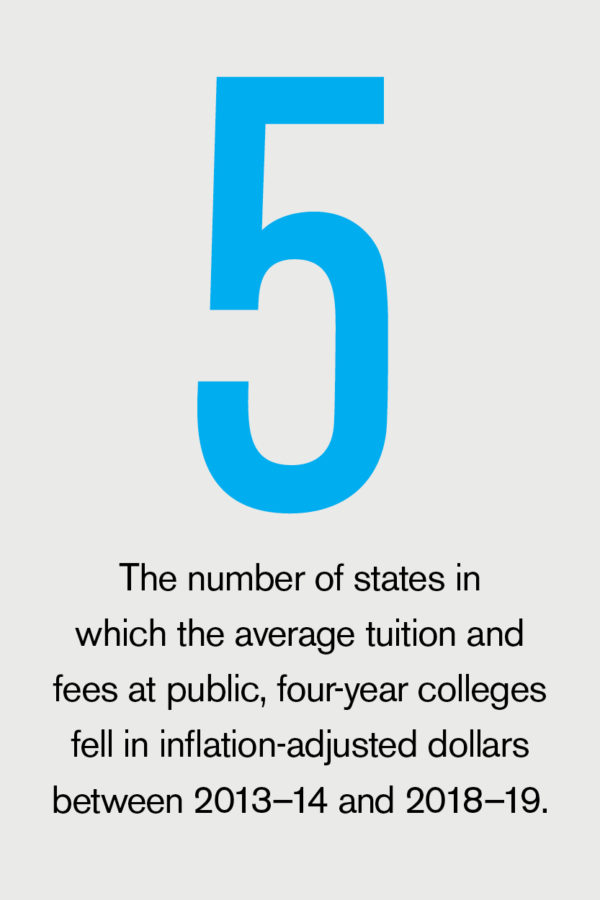
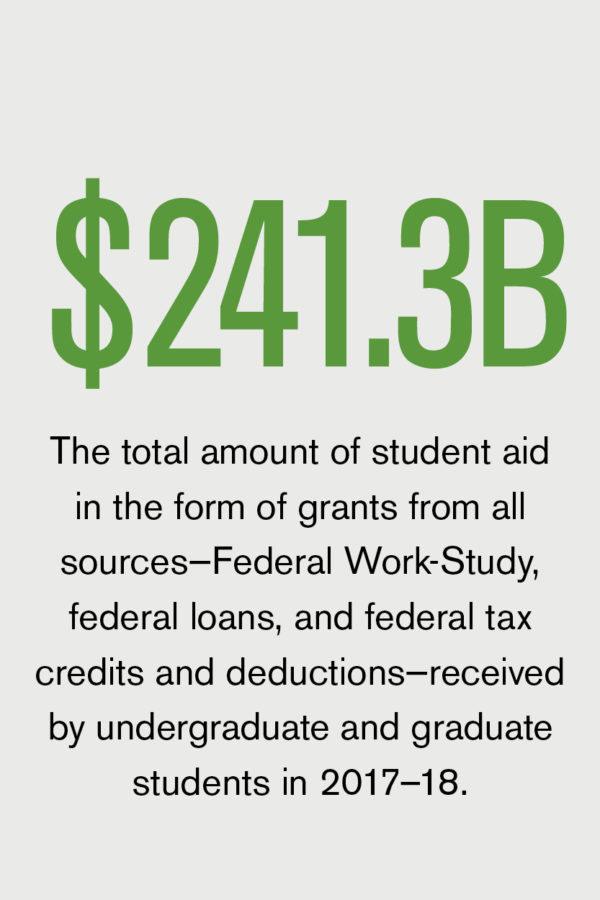
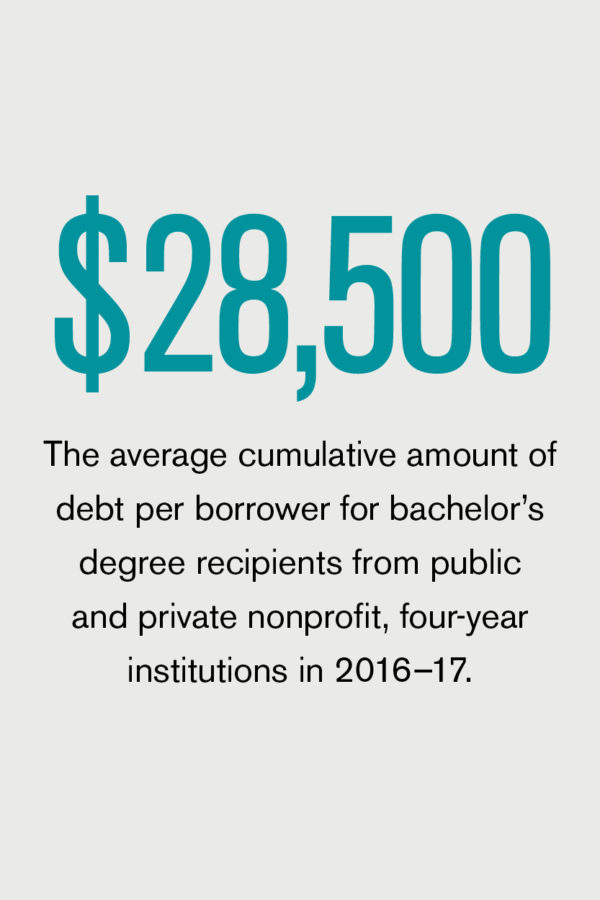
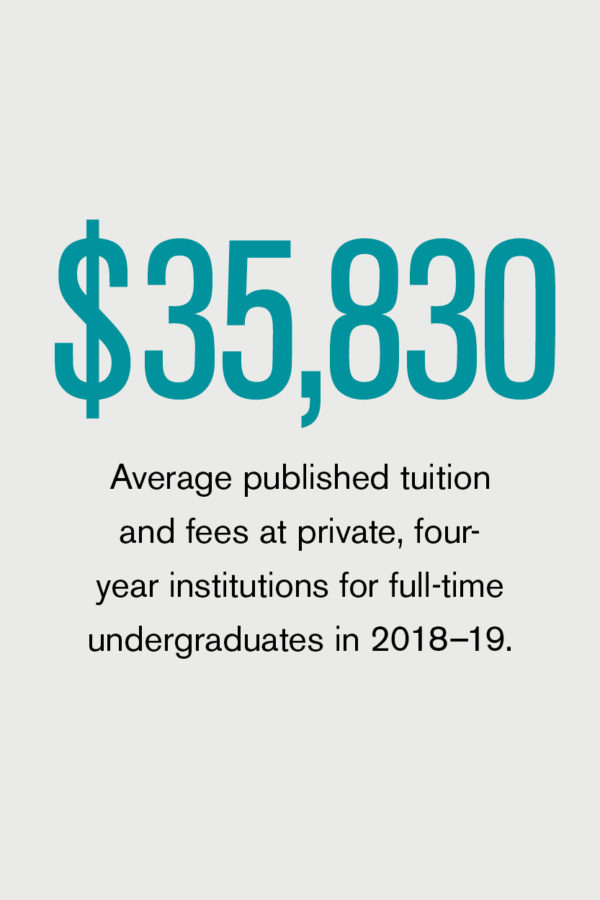
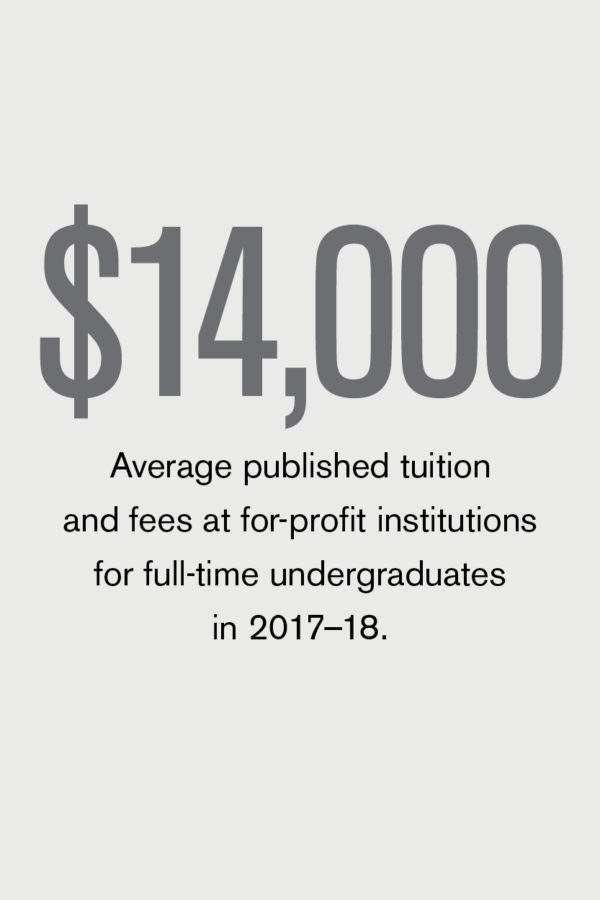
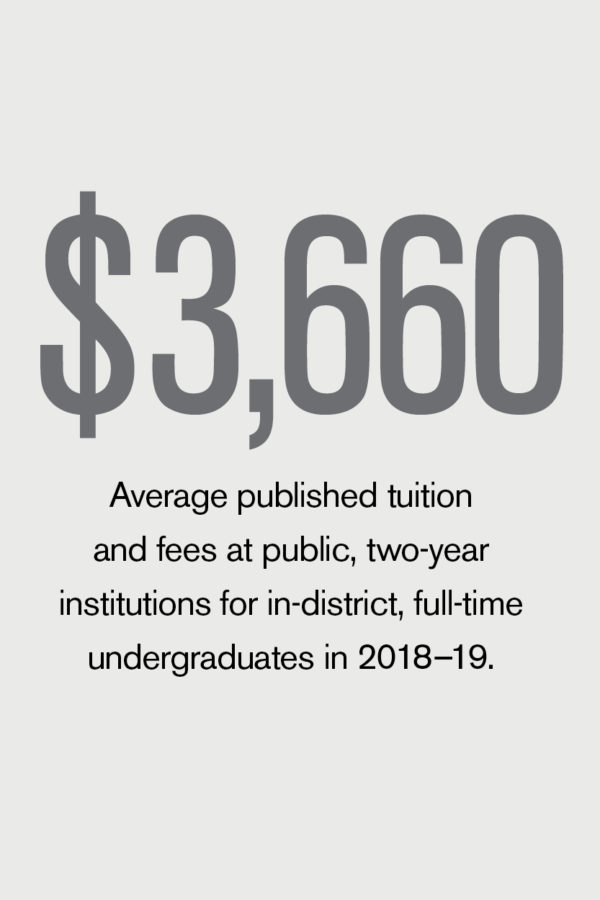
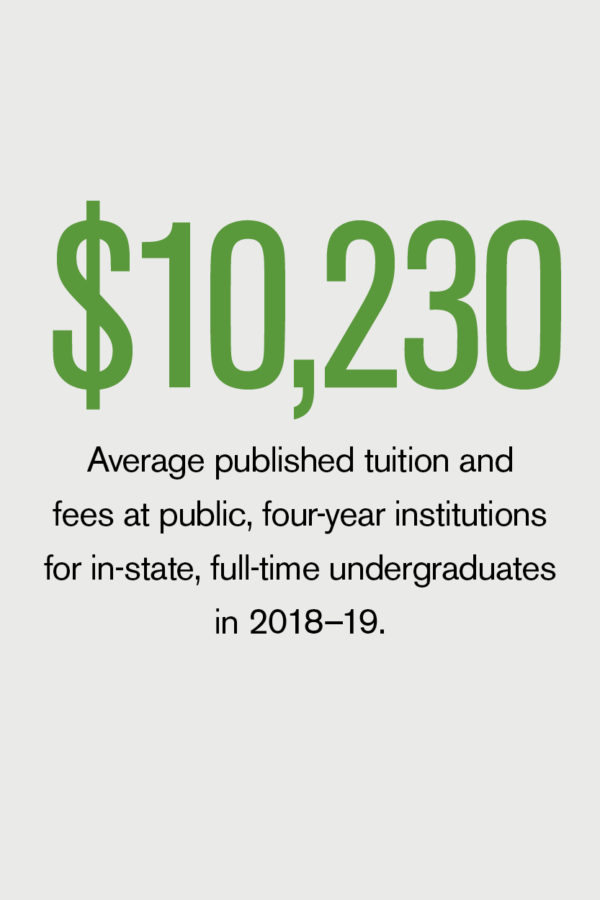
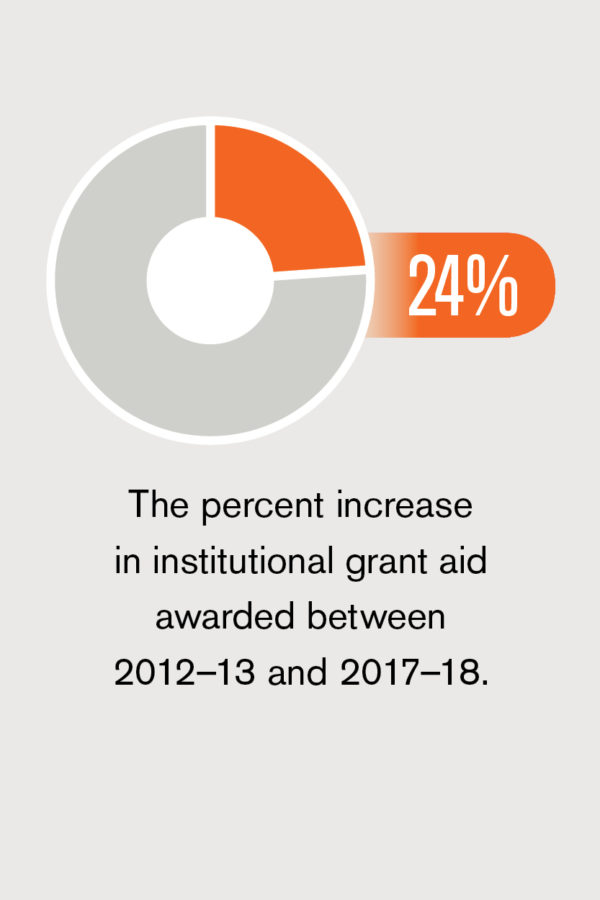
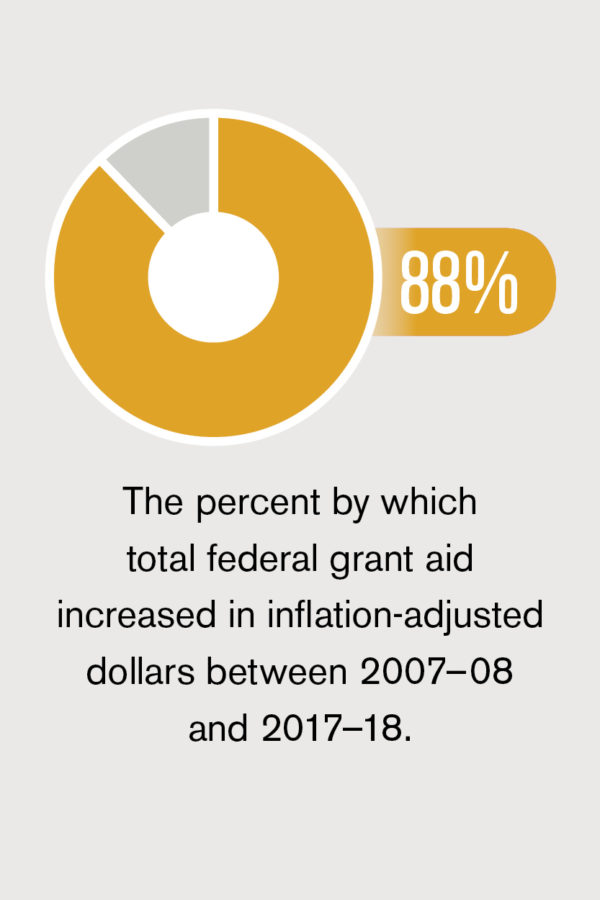
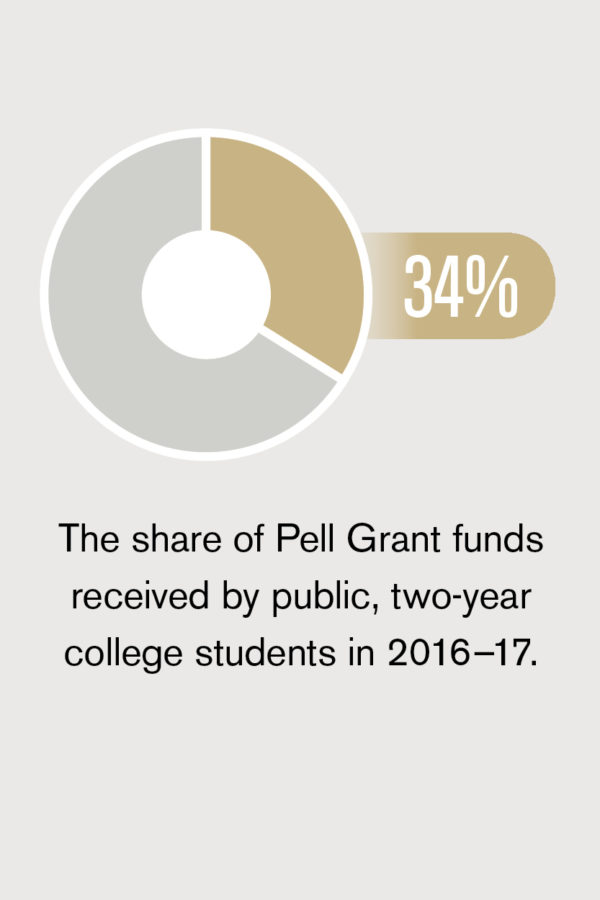
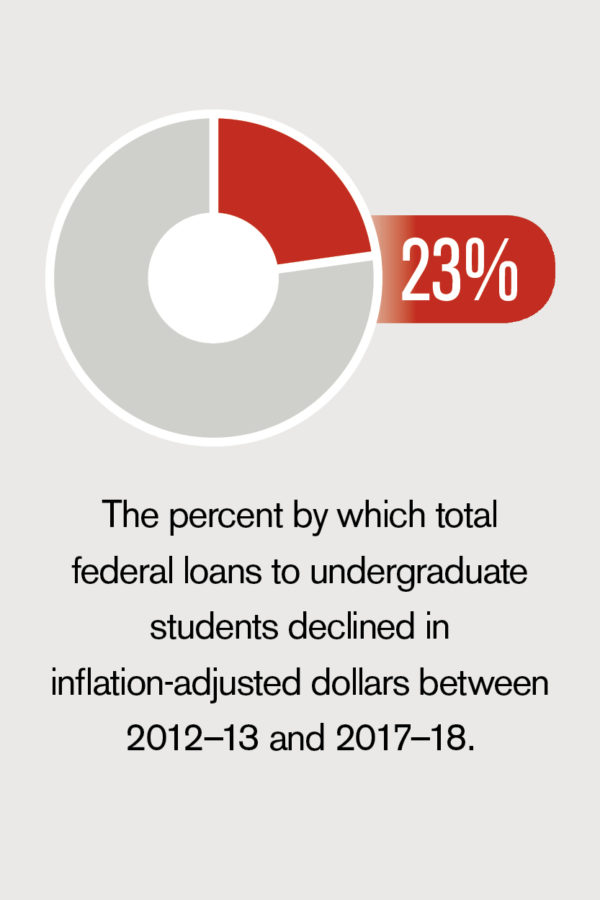
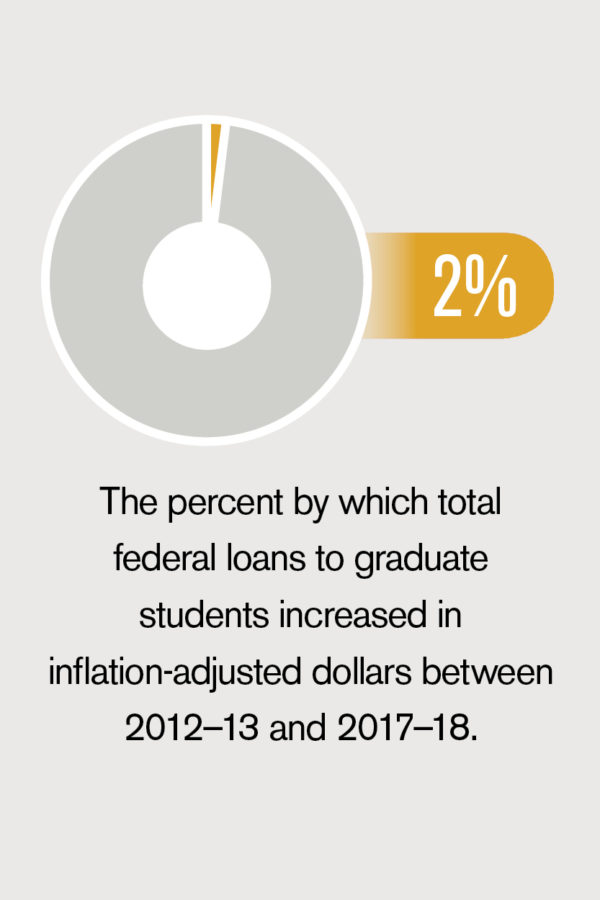
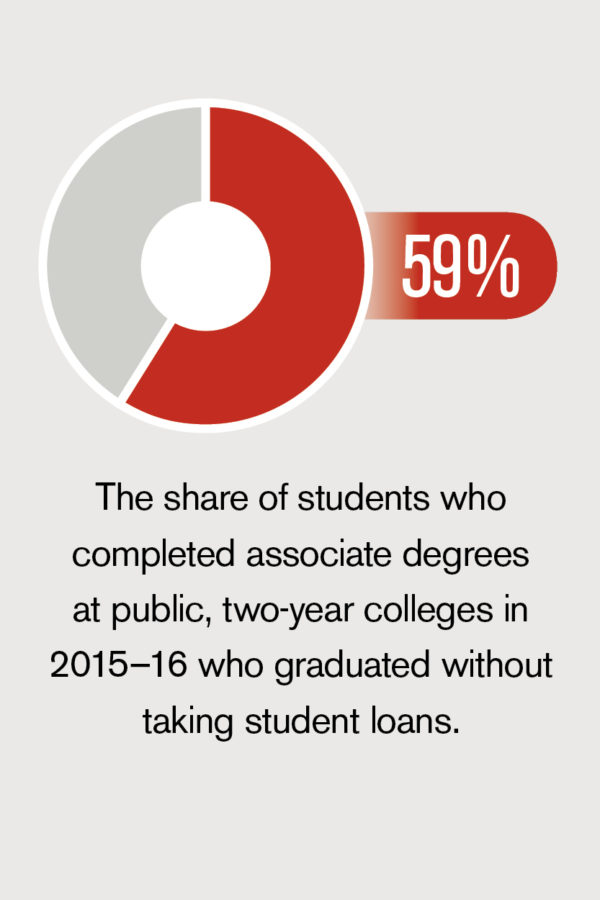
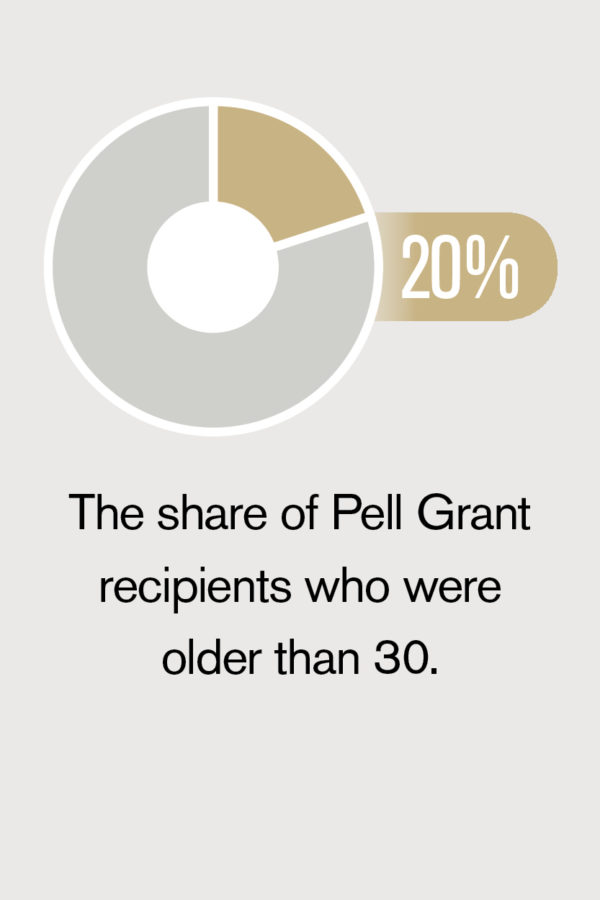
Trends in College Pricing and Student Aid
Trends in College Pricing and Trends in Student Aid are annual reports that are part of College Board’s Trends in Higher Education series, which is designed to provide a foundation of evidence to strengthen policy discussions and decisions in higher education.
The Trends in College Pricing 2018 report provides information on changes in undergraduate tuition and fees, room and board, and other estimated expenses related to attending colleges and universities between 2008 and 2018. Trends in Student Aid 2018 provides information on the funding that is available to help students pay for college, including grant aid and loans.
See below for the By the Numbers infographic.
On average, the world has developed only 62 percent of its human capital. In other words, nations are wasting about 38 percent of their talent.
–The Global Human Capital Report 2017
Fast Fact
Families Pay Nearly Half of College Costs
Family income and savings covered nearly half (47 percent) of all college expenses last year, according to How America Pays for College 2018, a national study from Sallie Mae and Ipsos. The annual report examines how families paid for college, how much they spent, and how they made their funding decisions. The average amount spent on college in 2017–18 was $26,458. Three quarters of college funds came from sources other than student loans. Nearly half of college costs, 47 percent, were paid out of pocket with parents’ and students’ income and savings. Scholarships and grants paid 28 percent of college costs, and loans covered 24 percent of college costs. Extended family and friends paid an additional 2 percent of college costs.
Navigating Digital News Is Challenging
Young adults believe news is valuable to their lives and to society, on the whole, and many see themselves as active participants in its dissemination. Yet, the new digital environment and current political reality have made successful navigation extremely difficult. How Students Engage With News, a new report funded by the John S. and James L. Knight Foundation and a grant from the Association of College and Research Libraries, explores how college-age students in the U.S. are accessing, consuming, and engaging with news in the digital era. Young adults receive news from several sources, such as peers (93 percent), social media (89 percent), online newspapers (76 percent), and news feeds (55 percent), the report said. More than two-thirds of the respondents said the sheer amount of news was overwhelming; half agreed it was difficult to tell which were the most important news stories on a given day (51 percent).
![]()
By The Numbers
Trends in College Pricing and Student Aid
Sources: Trends in College Pricing 2018; online at https://trends.collegeboard.org/college-pricing; and Trends in Student Aid 2018


