


At a number of colleges and universities, decisions about institutional grant aid for undergraduate students have become a key driver toward achieving financial goals. But in times of fiscal or enrollment stress, when grant spending becomes too high or fails to deliver the desired number or types of students, college and university presidents often call on their boards, chief business officers, and other staff to reexamine their institutional grant programs.
Sometimes, a fresh look at an aid program brings about minor adjustments, while other times it motivates a major overhaul, with new funding and new goals committed to attracting and supporting more students sought by the institution. But at the vast majority of campuses, these efforts to dig into institutional aid data are seldom tied to the college’s stated mission.
The need for campus leaders to have a better way of understanding the effects of their aid decisions on their institutional budgets prompted NACUBO and the Association of Governing Boards of Universities and Colleges (AGB) to conduct the Looking Under the Hood Institutional Aid Metrics project. A key component of Looking Under the Hood is a new Web-based tool that allows the comparison of recent aid allocation trends by institutional type and other characteristics, as well as by self-identified peer institutions. The goal is to help CBOs and other campus leaders make more effective institutional grant aid allocation decisions.
Defining Dollars, Distribution
The current disconnect occurs because most higher education institutions make decisions about allocating grant aid without regard to key metrics, or to internal or external trends and points of comparison with peer institutions beyond standard measures such as the “tuition discount rate.”
To make more effective allocation and distribution decisions, CBOs need access to appropriate benchmarking tools, such as the one resulting from the NACUBO and AGB project, that will help them engage in deeper levels of discussion with their presidents and boards. Analyses that include comparisons of school data with national averages and peer group results—while addressing policy questions related to each institution’s historic mission and goals—would help CBOs and other leaders better demonstrate the full impact of their institutional grant decisions.
As further context for the analytical tool designed to make these linkages, consider the challenging questions CBOs, presidents, and trustees may face when they are asked about their institutional aid programs.
For example, how would chief business officers, college presidents, and college boards of trustees react if they learned that during the past three years, their undergraduate institutional grant expenditures grew by more than twice the rate reported by schools in their peer groups?
Or that their institutional need-based grant aid dollars were growing at only half the rate of their non-need awards?
Would college and university institutional leaders make different institutional grant aid allocation decisions if they had a set of tools they could readily use to track trends in their institutional grant aid distributions and then compare those trends with those at self-selected sets of peer institutions?
There is every reason to believe that analytical tools would make a difference in allocation decisions.
Institutional Financial Aid on the Rise
During the past decade, the amount of financial aid colleges and universities provide from their own coffers has risen faster than nearly any other education-related expenditure, especially at private nonprofit colleges and universities. According to the College Board’s most recent Trends in Student Aid (2013) report, higher education institutions spent $44.4 billion in scholarships, grants, and fellowships for students.
About 79 percent of these aid dollars were provided to undergraduate students. The amount of grant aid per full-time-equivalent student (FTE) student that was distributed directly from four-year private nonprofit college and university coffers rose 35 percent in inflation-adjusted value between academic year 2003–04 and 2010–11. In comparison, data from the U.S. Department of Education show that per FTE expenditures for instruction rose only 5 percent.
On the surface, this substantial increase in institutional aid might appear to represent the attempts of higher education institutions to address student affordability and access issues. Perhaps it represents efforts by higher education institutions to lower the price students and their families ultimately pay, which would, in theory, allow more students to enroll at a lower price.
The reality is much more complex, because various campus leaders may have different reasons for supporting increases in their financial aid budgets. CBOs, for instance, may want to allocate grant dollars as part of a strategy for increasing net tuition and fee revenue. They may believe that increasing aid spending might help attract and retain students who otherwise would be unwilling or unable to pay the cost to enroll on their campuses, and rising enrollments would ultimately offset any increases in scholarship allocations.
Trustees, on the other hand, may view increases in scholarship and grant spending as a way for schools to reach other goals, such as increasing the number of low-income students on campus or raising the institution’s academic profile in the “America’s Best Colleges” ratings sponsored by U.S. News and World Report.
Campus presidents may want to balance student access and institutional prestige goals, but fear that candid conversations about their use of campus-based financial aid could violate federal antitrust laws. Presidents also fear that regardless of the reasons for increasing their spending on institutional grants, the increased expenses could have unforeseen consequences for their institutions.
These increases are sometimes implemented without the benefit of good data and effective ways of demonstrating whether the aid allocations reflect campus goals and values. Lack of comparable data across institutions makes it impossible for institutions to accurately compare changes in aid spending. The lack of comparable data leads to growing concern among campus leaders that not only is the current level of aid awarding unsustainable, but that it is no longer contributing to overall institutional goals and objectives.
Better data and analytical tools are needed now more than ever to help schools make more-strategic decisions related to their institutional aid allocations. The increasing growth of institutional aid dollars, along with the need for campus leaders to have a better way of understanding these decisions, served as the impetus for NACUBO and AGB to launch the Looking Under the Hood Institutional Aid Metrics project.
Identifying Indicators
Funded by the Robert W. Woodruff Foundation in Atlanta and guided by an advisory board of chief business officers, trustees, and presidents, Looking Under the Hood is a two-and-a-half-year project designed to help college and university leaders make more informed institutional grant aid decisions. The project sets forth an initial set of institutional aid metrics—a standardized set of institutionally specific data that measure annual institutional grant expenditures, average award amounts, and other indicators. The Looking Under the Hood project is designed to create a standard set of indicators that trustees, CBOs, presidents, and other senior staff members can use to align their institutional grant aid allocation and distribution decisions with other institutional priorities.
Shirley A. Ort, associate provost and director, scholarships and student aid, University of North Carolina, Chapel Hill, and a member of the Looking Under the Hood advisory committee, believes this alignment is critical for senior leaders at all types of higher education institutions. “There has been less attention—and probably less clarity—around financial aid budgets,” Ort says. “This tool can help policy makers and administrators understand the broader context of their aid policies, allowing for better, more-informed decisions about using institutional resources.”
Wendy Libby, president, Stetson University, DeLand, Florida, and another member of the project advisory committee, believes that including senior leadership in the development of these metrics is a unique aspect of the Under the Hood project. “Universities taking control of the definitions and development of the right metrics allows our stakeholders to view a more accurate picture of our institutions and their competitive environments,” she says.
The metrics (described more fully below) have been incorporated into an online benchmarking tool that allows institutional leaders to view their infor-mation and compare it against averages by type of institution and Carnegie class, as well as by self-selected groups of peer institutions. The comparisons give campus leaders the opportunity to adopt the metrics and the tool as a practice to annually examine their total financial aid expenditures, award recipients, and other key institutional aid indicators.
Developing Institutional Aid Metrics
Three key policy questions guided the advisory committee in the development of the metrics:
- Are institutional aid policies consistent with the mission and values of our institution?
- Is institutional aid being delivered to the types of students we most want to see on our campus?
- Is aid ultimately going to students who succeed (i.e., do students who receive our grants graduate)?
The advisory committee felt that the types of metrics adopted should reflect these questions as they would be the most relevant to many institutions regardless of their location, mission, or size of their enrollments and institutional aid budgets. The committee also indicated that the metrics developed should (1) be simple and drawn from easily accessible secondary data sources; (2) reflect an institutional perspective; (3) be relevant to a diverse set of higher education institutions; and (4) generate internal—not public—discussion. Along the way to creating these metrics, members of the advisory committee also expressed interest in the development of a dynamic Web-based tool to allow them to compare themselves with peer institutions using these key metrics.
“Peer comparisons can be enormously useful,” Ort says. “They’re already common for tuition and fees, cost of attendance, and other straightforward measures. Having a peer-based tool for institutional aid will be enormously useful to campus leadership.”
With these goals and key questions in mind, project staff collected data from both primary and secondary sources to develop the metrics. During the first 18 months of the project, staff members were able to access national data from several sources: the Integrated Postsecondary Education Data System (IPEDS) annual fall enrollment, institutional characteristics and finance surveys, and the College Board’s Annual Survey of Colleges (ASC).
Combined, these data sets provide information on institutions’ finances and their undergraduate institutional grant expenditures (including separate outlays for non-need and need-based grants) as well as institutional type and Carnegie classification, undergraduate tuition and fee charges, full- and part-time enrollment, and undergraduate student demographics, such as gender and race/ethnicity.
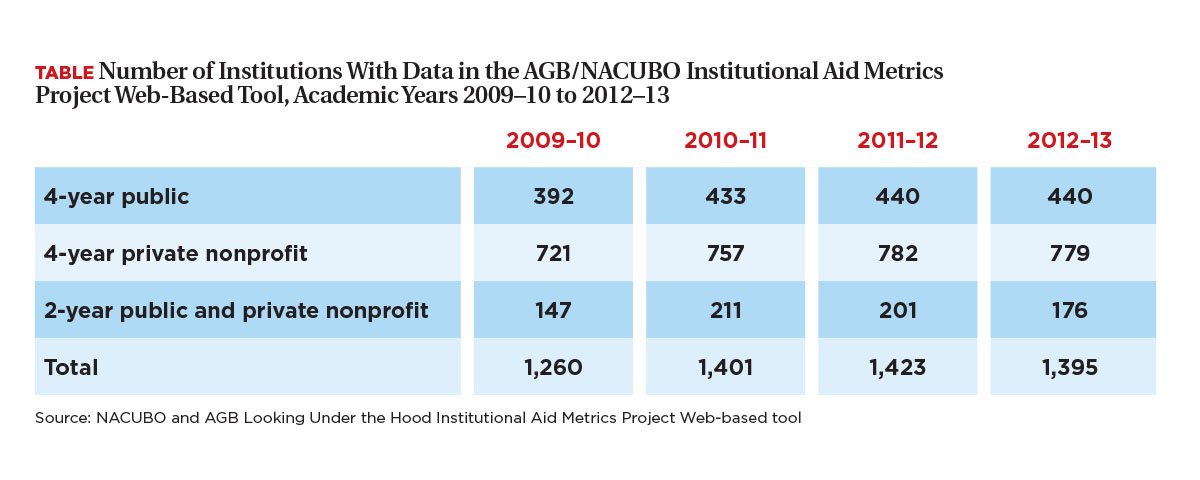
Using the IPEDS and ASC data allowed the project staff to include data from approximately 1,400 two- and four-year public and private nonprofit colleges and universities in the United States for academic years 2009–10 to 2012–13 (with plans for adding new and revised data as they become available in future years). The table provides the number of colleges and universities with full or partial data in the Web-based tool for each year from 2009–10 through 2012–13.
When combined, the data set was used to create the institution-level metrics related to financial aid funding and delivery. The metrics include a number of important measures of institutional grant aid:
- Institutional grant aid as a percentage of total operating expenses.
- Percentage of institutional grants awarded based on students’ demonstrated financial need (need-based institutional grant aid).
- Need- and non-need–based institutional grant dollars awarded per full-time-equivalent (FTE) undergraduate.
- Share of gross tuition and fee revenue used for institutional grants.
- Net tuition revenue (gross tuition minus grant aid) per FTE undergraduate.
The metrics also include other financial aid and student success indicators, such as average cumulative debt for graduating seniors and freshman-to-sophomore retention rates.
All metrics are currently available in a dynamic online benchmarking tool developed for this project, and currently being piloted by colleges represented on the advisory committee. The tool includes policy questions designed to generate discussions at the CBO, president, and board levels. Data for each metric provide some answers, but institutions are strongly encouraged to conduct further investigations with their own data to gain complete understanding of the trends examined by the tool metrics.
Using the Tool
Following are examples of questions and data tables currently available in the tool. These scenarios show how the metrics can serve as a catalyst for beginning high-level discussions on many campuses about the effects of institutional financial aid policies and practices.
Scenario 1: Evaluating Net Tuition Revenue
What is our net tuition revenue (gross tuition minus institutional grant aid) per FTE undergraduate?
Many CBOs, trustees, and other leaders want to know how much tuition and fee revenue their colleges and universities generate as a result of their institutional grant aid allocations. Institutional grants have the potential for bringing in more revenue by attracting undergraduates who might not have attended their schools without such aid. However, if the institutions provide too much in grant aid, they risk losing revenue.
One way to measure the financial impact of institutional grant spending is to calculate a net tuition revenue figure per FTE undergraduate. Net revenue is simply the difference between gross revenue received from undergraduates’ tuition and fee payments, and the amounts institutions distribute in grants and scholarships to these students.
The calculation is adjusted for changes in FTE to account for changes in the size of student enrollment. Campus leaders hope the net revenue per FTE is rising, as that is a sign that their aid allocations—all else being equal—are helping to generate additional dollars per enrolled undergraduate. Net revenue is especially important for private four-year institutions with very small endowments, because such colleges and universities depend greatly on tuition and fees for operational revenue.
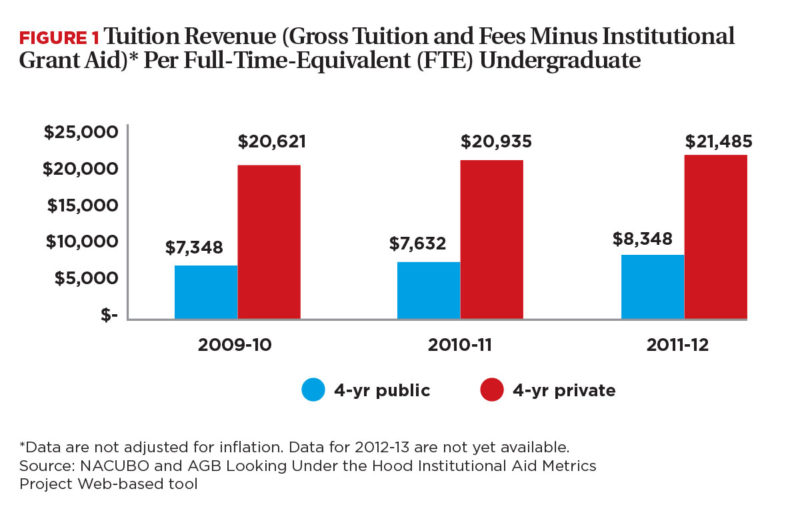
Figure 1, which was generated using the Web-based tool, shows average net tuition and fee revenue for academic years 2009–10 to 2011–12 (data for 2012–13 were not yet available) by type of institution in nominal (non-inflation–adjusted) dollars.
In addition to the institutional type averages shown on the figure, the tool facilitates users including data from their individual schools, which will allow campus leaders to compare their school’s data against broad institutional type characteristic averages. (To protect privacy, data for individual schools is not shown.) Users also are able to substitute their institutional peer groups for one of the four-year public or four-year private institutional categories on the chart.
As Figure 1 shows, average net tuition and fee revenue has grown by roughly $1,000 in nominal dollars. If they were aware of this information for other institutions, campus leaders could ask further questions internally to figure out why their result may be different than other school types.
Questions to Ask: Net Tuition Revenue
- What changes did we make in aid policies and practices that affect our aid budget relatively more than those of other schools?
- Are these changes intentional?
- What changes can our institution make to offset any coming longer-term declines in net revenue?
- Figure 1 reveals other interesting trends. Nationally, it appears that net tuition revenue has risen faster at public four-year institutions (13.6 percent) than at private nonprofit schools (4.2 percent). This trend leads to additional questions for campus leaders at public universities:
- What is driving this faster increase?
- Which types of students may be paying higher tuition rates despite any increases in grant aid?
- How is this trend affecting student access?
- Does this trend reflect intentional institutional grant aid and tuition policy decisions campus leaders made?
Scenario 2: Determining the Percentage of Need-Based Grant Aid
What percentage of our total institutional grant aid is awarded based on students’ financial need?
Campus leaders often want to know if their grant aid decisions are helping to expand access for low- and moderate-income students by increasing the number of financially needy students who enroll at their institutions. Concerns about the levels of enrollments of low-income and other needy students have risen dramatically during the past decade.
According to the College Board, the average list price of attending four-year public and private universities has risen faster than family income and the Consumer Price Index. As college costs have risen, more and more families have sought financial aid to help defray their expenses. Many institutions have reacted to the rising tuition costs by directing a greater portion of their available institutional grant funds to students with financial need.
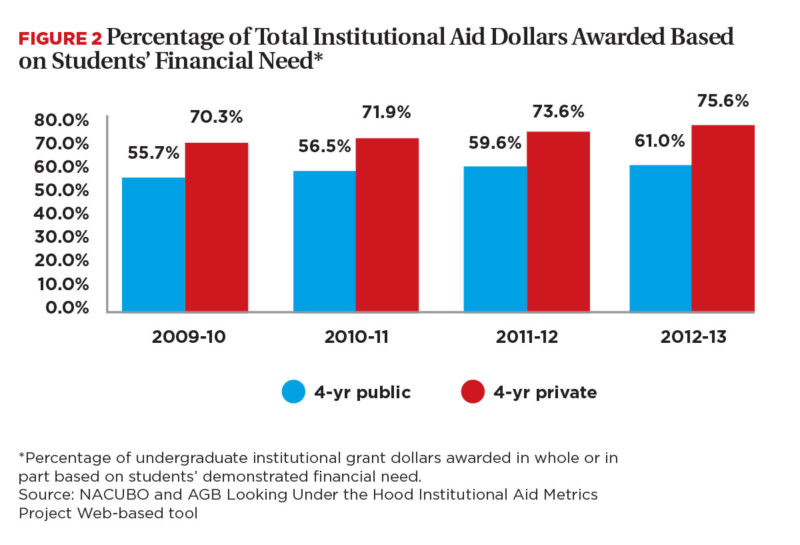
Figure 2 shows that during the 2009–10 to 2012–13 time span, the share of total undergraduate institutional grant aid dollars (based on scholarships, grants, and fellowships to undergraduates that were partially or wholly awarded based on students’ demonstrated financial need) rose from about 70 percent to nearly 76 percent at four-year private institutions and from nearly 56 percent to 61 percent at four-year public institutions.
(Each college and university determines financial need based on federal or independent formulas that estimate a family’s ability to pay for college. Need-based aid requires potential recipients to apply for financial aid at their institutions. Any merit- or other non-need–based grants that were awarded in part on the basis of financial need were classified as need-based grants.)
Several factors may explain this recent increase in need-based grant awards. First, economic factors—such as the Great Recession of 2008 and the resulting decline in employment and income among college-going students and their families—have likely made more students eligible for aid based on their families’ financial need and other circumstances. Second, rising college prices continue to make more students eligible for aid because the methodologies generally used to determine the level of students’ financial need are based in part on the costs of higher education. Third, and perhaps most important, intentional policy decisions by colleges and universities to direct more of their institutional grant aid toward need-based aid may be affecting the overall levels of grants awarded based on need. We hope college and university leaders will use the tool to examine these data in comparison to the data for their schools and decide which factor best fits within their context.
We also hope use of the tool will encourage leaders to ask additional campus-based-aid policy questions.
Questions to Ask: Percentage of Need-Based Grant Aid
- Do some colleges have an explicit goal for awarding more need-based institutional aid?
- If so, does the distribution of need-based institutional aid align with the college’s mission and goals?
Scenario 3: Percentage of Gross Tuition/Fee Revenue Used for Grants
What percentage of our gross tuition and fee revenue is used for institutional grants?
While schools may use a wide variety of resources to fund their institutional grant aid sources—such as endowment income, annual gifts from alumni and other donors, or sales of education-related goods and services—the vast majority of this aid comes directly out of tuition and fee revenue. CBOs particularly want to be aware of the effects financial aid decisions may have on tuition revenue as many schools use tuition and fee dollars to fund much of their education-related operations.
The Looking Under the Hood project has calculated total institutional grant aid as a percentage of gross tuition and fee revenue. Trends in this rate, shown in Figure 3, give CBOs, trustees, and other campus leaders the data they need to measure the potential impact of their financial aid allocations on overall institutional finances. If the percentage of revenue used for institutional grant aid is growing too rapidly, institutions risk having relatively less funding available for academic services or other vital functions.
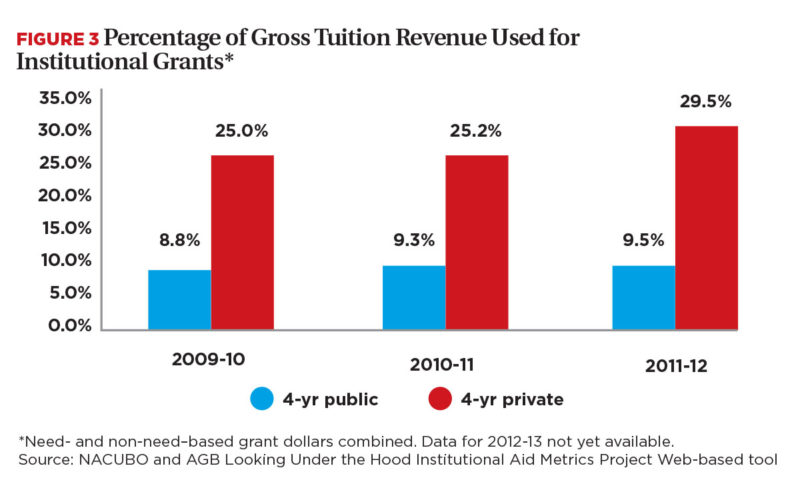
Figure 3 demonstrates the rapid rise of institutional grant spending relative to tuition and fee dollars, particularly at private nonprofit colleges and universities. In 2011–12 (data for 2012–13 were not available) total institutional grant expenditures (need- and non-need–based aid combined) on average equated to nearly 30 percent of tuition and fee revenue at four-year private nonprofit colleges and universities compared to 25 percent in 2009–10. At four-year public schools, on average, institutional grant expenditures were equivalent to about 9.5 percent of gross tuition and fee funds versus 8.8 percent in 2009–10.
Presidents, trustees, and other senior administrators probably would like to see how their institutions compare with these averages. Users of the Looking Under the Hood tool will be able to compare their data relative to these institutional type averages and relative to self-identified peer groups. Such comparisons will also likely bring more questions.
Questions to Ask: Percentage of Gross Tuition/Fee Revenue Used for Grants
- What effect does the rising rate of grants relative to revenue mean for other campus operations or missions?
- How sustainable are these rising rates; that is, do these rising rates have a potentially negative consequence for our colleges?
Future Scenario: Institutional Aid Awards by Income Level
What is the distribution of institutional aid awards by income level?
In addition to the metrics currently in the tool, project staff members hope to add additional data in the future that are based on the demographic characteristics of institutional grant recipients. We hope to expand the tool and create new metrics based on institutional grant aid recipients’ income levels, racial/ethnic characteristics, and other dimensions.
Unfortunately, no national secondary database currently collects data about institutional aid by income level on an annual basis. To illustrate how these metrics might look, the project staff collected income and demographic information from 10 of the institutions represented in the project advisory committee. Due to the small number of participants, these data are not included in the tool. However, the discussion below presents how these data might help CBOs and other leaders gain an even greater understanding of the impact of their aid allocations.
What is the “typical” distribution of institutional grant aid recipients among public four-year research universities? Data about the distributional effects of grant aid are often a key element of financial aid policy because they can address issues of institutional mission and access.
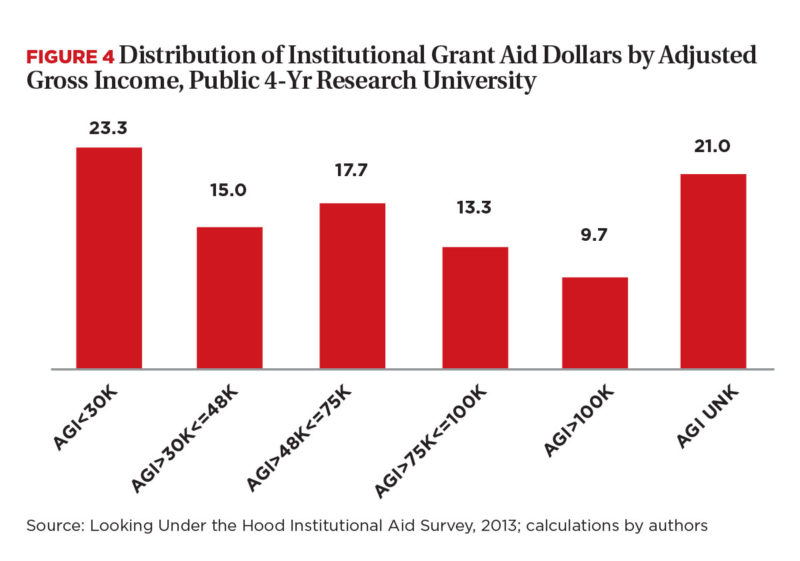
The example in Figure 4 provides revealing details about the flow of total institutional grant aid (need- and non-need grants combined) by income level at one participating school. At this sample school, in academic year 2012–13, about 38 percent of undergraduate institutional grant scholarship recipients had annual family incomes at or below $48,000, while 23 percent had incomes of $75,000 or higher. Twenty-one percent of institutional aid dollars flowed to students with unknown incomes. These recipients may have come from higher-income families or may have received scholarship awards that were based entirely on academic merit or other non-need criteria, and thus no income data from them were collected. These data indicate that at this institution, grant aid is generally targeted toward undergraduates from lower-income families.
The institution in this example may have a policy that directs more institutionally generated scholarship dollars toward low- and moderate-income students. But how do data from this sample school compare with national, regional, or peer-group averages?
We believe that if more colleges had access to this type of institutional aid information, campus leaders could better understand where their institutional aid dollars are going, and could better determine whether the distribution of their aid dollars reflects strategic institutional goals or the overall mission of their institutions. In other words, are their distributions of institutional grant aid by adjusted gross income the result of campus leaders making intentional financial aid policy choices? We believe that most boards of trustees, CBOs, and presidents think they should be.
What Does It All Mean?
As we have already noted, the AGB/NACUBO Looking Under the Hood Institutional Aid Metrics Project Web-based tool is designed specifically for institutional use and to encourage more strategic conversations among trustees, presidents, CBOs, enrollment managers, and other campus leaders about their institutional grant aid allocation decisions. The data and policy questions the tool poses give campus leaders more granular, institution-specific data that show how institutional scholarship and grant aid is being used. Having this information could prove vital to a number of institutions.
As Stetson’s Libby observes, “The tool gives us the opportunity to look at the data and trends over time, which provides us with a more dynamic picture of how our universities are operating and where strategic prioritization is a must.”
The metrics developed by the advisory committee also provide other advantages. The descriptive data that illustrate the distribution of need- and non-need–based aid, for example, can demonstrate how institutional aid expenditures align with the espoused mission and values of senior campus administrators and/or the board of trustees. CBOs and enrollment managers can use these metrics to track changes over time in the distribution of campus-funded financial aid.
Any findings from these inquiries may prove to be the most useful function of these metrics. They can help campus committees and decision makers to determine how shifts in expenditure plans align with changes in an institution’s strategic plans. Hopefully, dramatic shifts in the allocation of scarce campus aid resources reflect intentional decisions. When they do not, the benchmarking tool can serve as an effective mechanism for stimulating discussions about what happened and what steps can be taken to minimize the chances of surprises in the future.
The comparisons with peer institutions also have the potential to answer the ever-important question of “how are we doing,” especially when compared with similar types and sizes of institutions. The ability to compare expenditures with peer institutions can help CBOs, enrollment managers, presidents, and boards of trustees to address a number of broader institutional aid policy questions.
Questions to Ask: Strategic Alignment
- How similar are our aid expenditure patterns with peer institutions?
- Is “similar” a desirable place to be?
- Are our patterns substantially different because of unique circumstances, such as the state in which we are located, or are they the result of a state financial aid program that differs from most states?
- Or are they different for reasons that are not central to our mission or that are not desirable?
Institutional aid expenses are among the largest at many private colleges and universities and a growing number of public universities. And yet, reasons for the rapid rise in these expenses are not very well understood, perhaps because these reasons could vary radically from campus to campus. With growing federal and state pressures on higher education accountability, now is the time to get a better understanding of the effects of rising institutional scholarship and grant aid on a school-by-school level.
The metrics and questions posed by the Looking Under the Hood project are one step toward helping institutional leaders gain greater insights on the effects of their institutional aid spending and allocation decisions. By itself, the Web-based tool will not answer these questions, but it can serve as a catalyst for many institutions to begin these important discussions.
DEREK PRICE is the principal owner of the consulting firm DVP-PRAXIS Ltd. DON HOSSLER is director of the Center for Postsecondary Research and professor of educational leadership and policy studies, Indiana University, Bloomington.